
Asians will be largest immigrant group in US by 2055

MPI.ORG
LOS ANGELES –Asians have become the fastest growing ethnic group in the U.S., according to a new study released this month on the diversity of the population.
According to a study by the Pew Research Center, the Asian population in the U.S. grew a whopping 72 percent between 2000 and 2015 — from 11.9 million to 20.4 million — making Asians the fastest growing racial or ethnic group in the nation.
Hispanics, the second fastest growing group, increased 60 percent.
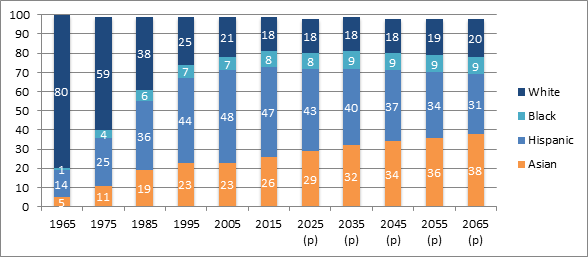
Reflecting the fast growth rate, the study projected Asians to become the largest immigrant group in the U.S. by 2055, surpassing Hispanics. Asians are predicted to comprise 38 percent of U.S. immigrants in the next 50 years, while Hispanics are expected to comprise 31 percent.
Around 20 million Asian Americans trace back to over 20 countries in East and Southeast Asia and the Indian subcontinent, making the U.S. Asian population very diverse. Together, 19 of the largest Asian origin groups comprise 94 percent of the total Asian population in the U.S.
Filipinos among largest groups
While no single group dominates the U.S. Asian population, Filipinos were among the largest.
As of 2015, the largest groups were Chinese who made up 24 percent (4.9 million), Indian at 20 percent (4.0 million), and Filipino at 19 percent (3.9 million). Also meeting the one million mark were those with Vietnamese, Korean, and Japanese roots.
Filipinos were also reported to be among the four Asian countries out of top 15 origin groups with large amounts of unauthorized immigrants. Out of the country’s 11.1 million unauthorized immigrants, 13 percent are Asian with most coming from India (500,000), followed by China (325,000), Philippines (180,000), and Korea (160,000).
The study also analyzed the economic data of the U.S. Asian population and found that in general, Asians were more well off compared to the U.S. population as a whole, but economic well-being did vary among subgroups.
Asian American-headed households held a median annual household income of $73,060, compared to the U.S. median of $53,600. Filipinos were among the Asian subgroups with the highest median income at $80,000, right after Indians who held a median of $100,000, and before Japanese and Sri Lankan, which held medians of $74,000 each.
Less likely to be poor
Asians were also less likely overall to live in poverty in comparison to the general U.S. population in 2015 (12 percent vs. 15 percent), but it again was varied among groups. Eight of the 19 groups experienced saw high poverty rates with the highest being among Hmong (28.3 percent), Bhutanese (33.3 percent), and Burmese (35 percent). Among the lowest poverty rates were Filipinos and Indians (each 7.5 percent), and Japanese (8.4 percent).
Around half (51 percent) of Asians ages 25 and older have a bachelor’s degree, according to the study. Indians were found to have the highest level of educational attainment with 72 percent having at least a bachelor’s degree.
Also having high levels of education were Sri Lankans (57 percent), Mongolians (59 percent), and Malaysians (60 percent). On the lower end were Cambodians (18 percent), Hmong (17 percent), Laotians (16 percent), and Bhutanese (nine percent). Filipinos were in the middle with 46 percent having a bachelor’s degree or more.
More proficient English speakers
Unsurprisingly, Filipinos were among the groups containing a large majority of proficient English speakers. According to the study, seven out of 10 Asians in the U.S. ages five and older spoke proficient English in 2015. At the top were Japanese (84 percent), Filipinos (82 percent), and Indians (80 percent). The study also reported 32 percent of overall Asian Americans as speaking only English in their homes, and the rest speaking another language.
The study used a three-year dataset gathered from the U.S. Census Bureau’s 2013 to 2015 American Community Survey’s public-use files, with additional data on population estimates from the Census Bureau’s 2012 report, “The Asian Population: 2010” (2000 and 2010) and tables from American FactFinder (2015).
