
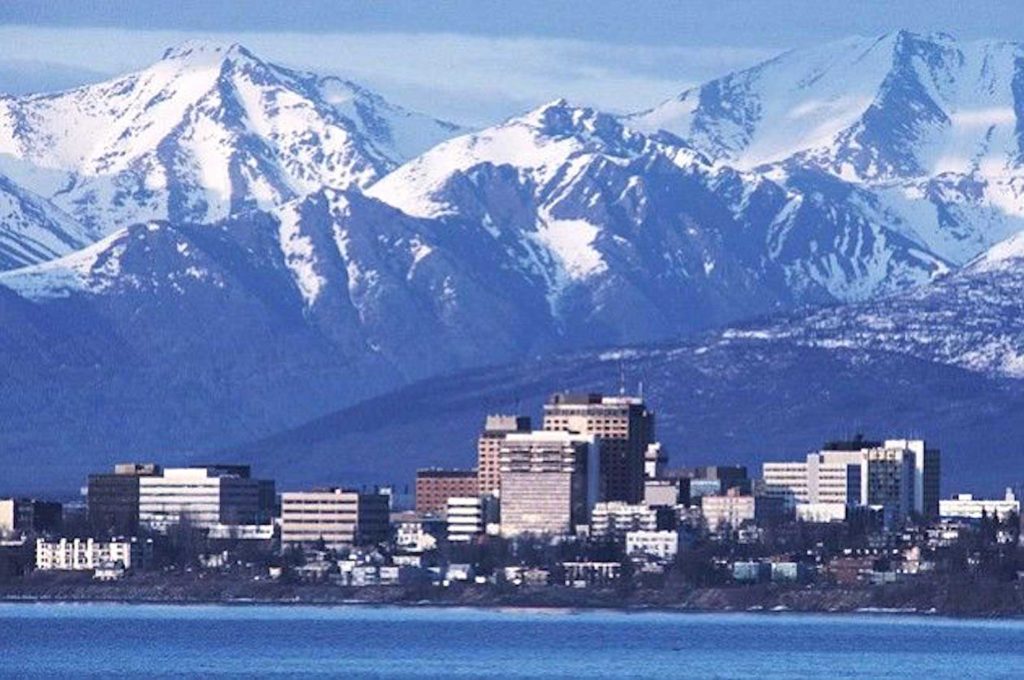
A vies of Anchorage, Alaska skyline. PINTEREST
Guess where Filipinos are the No. 1 Asian group in the U.S.? If you answer Daly City, California, we have a problem.
No, the states where Filipinos are the No. 1 Asian American group by percentage were highlighted by the Pew Research Center last week.
The top 3 are fairly obvious. Nevada with Filipinos at 52% leads the pack. Due to gambling? Well, no. More like the hotels. And the strong unions. Another of the top states is Alaska, where at 51% of Asian Americans, Filipinos dominate. But you had that feeling with Filipinos finding their way to the Alaskan canneries in the 1920s and 1930s.
The next top state where Filipinos are No. 1 is Hawaii, where Filipinos are 39% of Asian Americans. But once again, no surprise considering the Sakada movement in the 1906 where Filipinos came to the territory to work the plantations.
OK, so name the other states. Bet you can’t name one.
I couldn’t believe it myself, but Pew lists North Dakota with Filipinos at 26% of the Asian American population at No. 1.
North Dakota? Like the movie “Pargo”? Could South Dakota be in the mix? Yes, Pierre (capital of SD). Filipinos are No. 1 in that state with 19% of the Asian American population. In fact, the trend spreads throughout the northern part of the U.S. with Filipinos the No. 1 group in Montana (24%) and Idaho (23%).
And we’re a close No. 2 in the other states in that region: Wyoming (19%, second to the Chinese with 22%); and we’re No. 2 in Utah (15%, second to the Chinese with 19%).
But here are more surprising No. 1’s: Filipinos are the top group in New Mexico (22%), which means we should have seen some Filipinos in “Breaking Bad.” And we’re No. 1 in West Virginia (21%). Filipino Hillbillies?
My point is, in 2021 Filipinos and Asian Americans are everywhere, more than we realize. Filipinos No. 1 in South Dakota? Malamig doon!!!! Add Alaska to the mix and cold-weather Filipinos are the reigning champs among Asian Americans in their respective states.
But now for the existential question. After a week, it’s fair to ask: “Why is this Asian Pacific American Heritage Month different from all other APAHMs”?
It’s simple. It’s because most of us have the name wrong. Maybe even the time wrong. That I call it “APA Heritage Month” means I’m an OG. There are multiple meanings for these initials, though I prefer “original gangster.”
Heritage X was first just a week back in 1977, then quickly expanded to its full monthly status when President Jimmy Carter, who now looks like a peanut, signed it into law Oct. 5, 1978.
But why in May? It’s likely because one of the proponents , Norman Y. Mineta, then a congressman from California, was of Asian American Japanese descent and Japanese immigrants first came to the U.S. on May 7, 1843. Add that the railroad was built by Chinese immigrants on May 10, 1869, and why wouldn’t May be considered the month we all celebrate?
Too bad there wasn’t a Filipino American congressman to let everyone know that the very first known landing of Filipinos to the U.S. was on Oct. 18, 1587 on the Central Coast of California. It’s the reason why October is Filipino American History Month. But for the first Asians to arrive in the U.S., maybe October should be the month for all Asian Americans.
That’s the time problem. Now what about the name? In 2009, Obama changed the name of the month from “APA” to “AAPI” for Asian American Pacific Islanders. Did someone complain, “What’s a Pacific?” Maybe because the islanders got their due. But given that Obama was born in Hawaii, it’s funny he forgot about his native Hawaiian homeys.
This year, without much fanfare, the Hawaiians got theirs. Biden signed the proclamation and now the month officially is called “Asian American Native Hawaiian Pacific Islander Heritage Month” or AANHPIHM, a/k/a “An hippie hymn.”
Hippie hymn? Isn’t that Iron Butterfly’s “Innagaddadavida”? From my perspective, I think Biden’s right on his $4-trillion dollar human infrastructure and American renewal plans. I just have a problem with inclusion that begets us a bad acronym. Biden should have an ear for better. His penchant for quoting Irish poets should have kept us from “an hippie hymn.”
As a reality check see how many people are saying it the new way. I’ve seen it said all ways. AAPI Heritage. APA Heritage. Asian month. Admittedly, I have seen the new, all-inclusive, but non-melodic AANHPIHM.
Our broader numbers
At least finally, most non-Asians are noticing us. Or at least our hashtag, #StopAsianHate. It only took a year of Trumpian scapegoating, resulting in nearly 4,000 self-reported racial transgressions against all Asian Americans. No matter the ethnicity. We were all seen as one.
And to top it all, there was Atlanta on March 16 when confessed gunman Robert Aaron Long went to three different massage spas and killed eight people, six of whom were Korean American women. Hate crimes or not, the public has been exposed for its general ignorance of Asian Americans.
To prove it, many non-Asians still see “Asian American” as synonymous with Chinese.
We’re not.
We’re about 23 percent Chinese, or 5.4 million people. Indian Americans are 20 percent, or 4.6 million people. And Filipinos are 18 percent (4.2 million).
Close to sixty-two percent of all Asian Americans are Chinese, Indian, or Filipino, making the top 3 definitely Chindipinos.
And the Vietnamese? Just 9 percent. Korean, 8 percent. Japanese 6 percent. The remaining 15 percent are from 13 other countries. (All numbers are from data released just last week from the Pew Research Center’s analysis of Census data).
There’s so much diversity, Asian Americans should be beyond stereotyping. With Indians and Filipinos making up nearly 40 percent of the group, the racists who feared “yellow peril” would have to update the phrase in 2021 to some shade of brown.
In fact, Asian brown is set to overtake Hispanics in the U.S. by 2060, when the Asian American population is expected to double from 23 million to 46 million, according to Pew Research.
And we’re all over the map. Chinese dominate in the West and New York. Indians dominate in the Midwest, Northeast, and Southeast. And Filipinos, surprise to surprise, not just No. 1 in Hawaii and Alaska, but in Montana, North Dakota, South Dakota and West Virginia? Are they Joe Manchin voters?
The numbers are the most basic level of awareness, with the fastest-growing Asian American groups by percentage being small ethnic groups like the Bhutanese, Nepalese, and Burmese–tenfold growth or more between 2010 and 2019.
These small groups are typical of the vast disparities among Asian groups. Take the Nepalese. In education, 42% of the Nepalese have a high school education or less, compared to 27% for all Asians, and 39% of all Americans.
Bachelor degree holders are 2% of Nepalese, compared to 30% of all Asians, and 20% of all Americans.
On economics, 17% of Nepalese live in poverty. That’s worse than all Asians at 10%, and about the same as all Americans at 13%. The median household income for Nepalese is about $55,000, vs $85,000 for all Asians.
Sounds like the Nepalese are a lot more model American than model Asian. But that’s the point about AANHPIHM. We’re a diverse bunch.
On my “Emil Amok’s Takeout,” my show on Facebook Live @2pmPacific, I highlight a different group every day. This week I’ll zero in on the Filipinos. Listen.
Emil Guillermo is a journalist and commentator. He writes a column for the Inquirer’s North American Bureau. His vlog is on www.amok.com. Listen to him live on Facebook @emilguillermo.media
